
The main chain-level metrics are calculated in the same way as the metrics for individual locations that belong to the chain. To understand why chain analytics is important, read this article.
In the chain interface, under Analytics > Summary Report, you’ll find consolidated analytical data for the following metrics:
- Revenue
- Average bill
- Average occupancy
- Clients (new, returning, lost)
- Appointments and visits (visit status, booking source)
Important
Analytics is generated only for visits with the status “Arrived” within the selected period.
The icon next to each metric shows its trend compared to the previous period of the same length.
Visits with the status “Arrived,” even if they include listed services or products but do not include a phone number, are not counted as clients and are not included in new, returning, or lost client metrics.
How to read the report #
- To generate the report, go to Analytics > Summary Report.
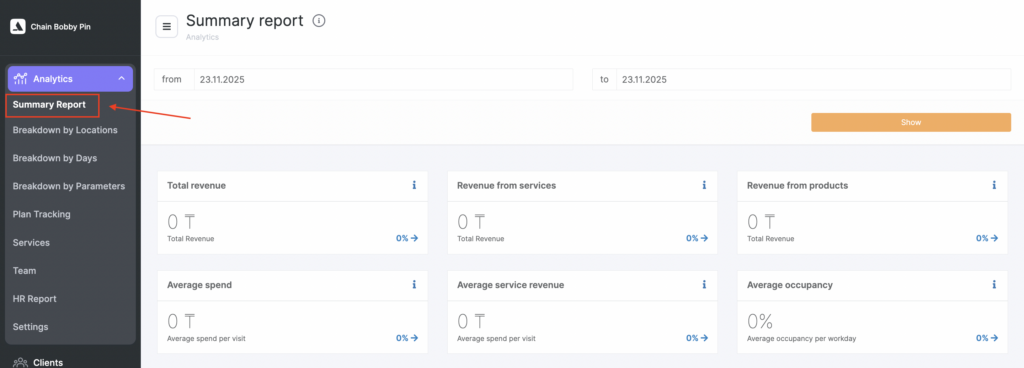
- Metrics are generated based on the selected period. Choose the dates and click Show.
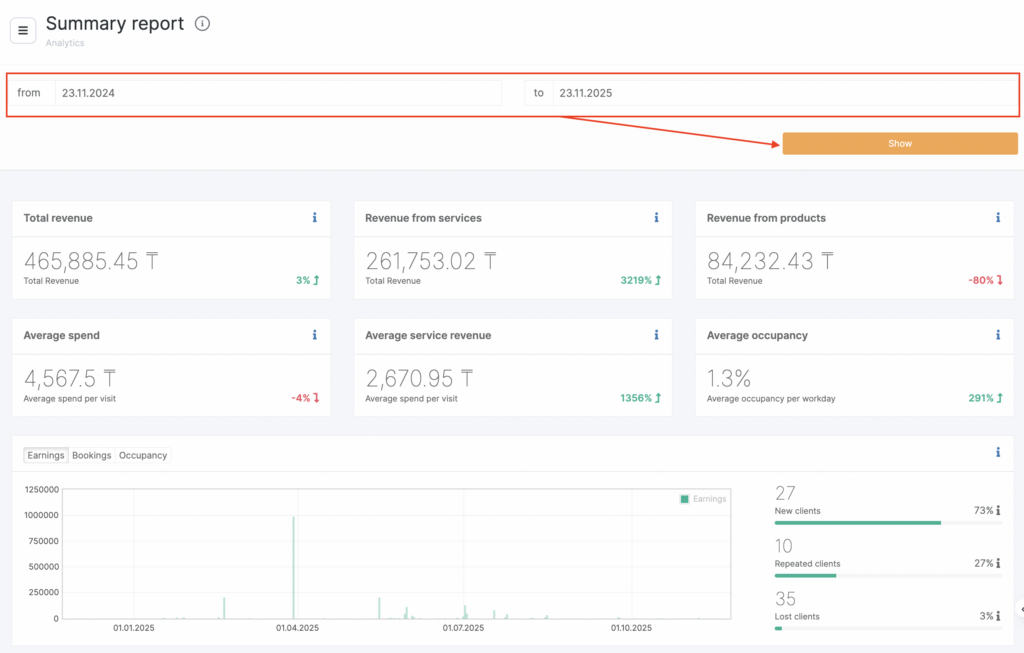
How metrics are calculated #
Tooltips in each metric block provide detailed information on how the metric is calculated. Click the i icon to open a tooltip.
Revenue #
- Revenue. Total cost of services and products in visits with the status “Arrived,” plus product sales outside of visits.
- Service revenue. The total cost of services in visits with the status “Arrived.”
- Product revenue. The total cost of products sold in visits with the status “Arrived,” plus product sales outside of visits.
Important
All revenue metrics are calculated based on the cost of services in “Arrived” visits — both with and without a phone number. Product sales are counted the same way.
A phone number is required for correct calculation of the average ticket per client per visit.
Average Spend #
The full revenue metric is not used to calculate the average ticket. The calculation is based only on visits and product sales that include a phone number. This portion of revenue is not shown as a separate metric.
- Average spend. Revenue from services and products for the period divided by:
visits with clients during the period + bookings without clients during the period + product sales during the period. - Average service revenue. Service revenue divided by:
visits with clients during the period + bookings without clients during the period.
Average Occupancy #
The total duration of visits with the status “Arrived” is divided by the total working hours of team members.
Important
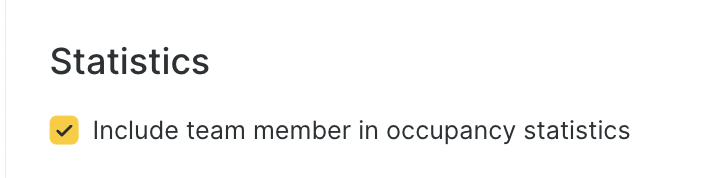
Average occupancy may be inaccurate if employees who do not provide services (such as receptionists) are added to the schedule with working hours. They have no appointments, yet they appear in the statistics.
You can exclude these team members from occupancy statistics by unchecking the option Analytics > Include in occupancy statistics in the team member settings:
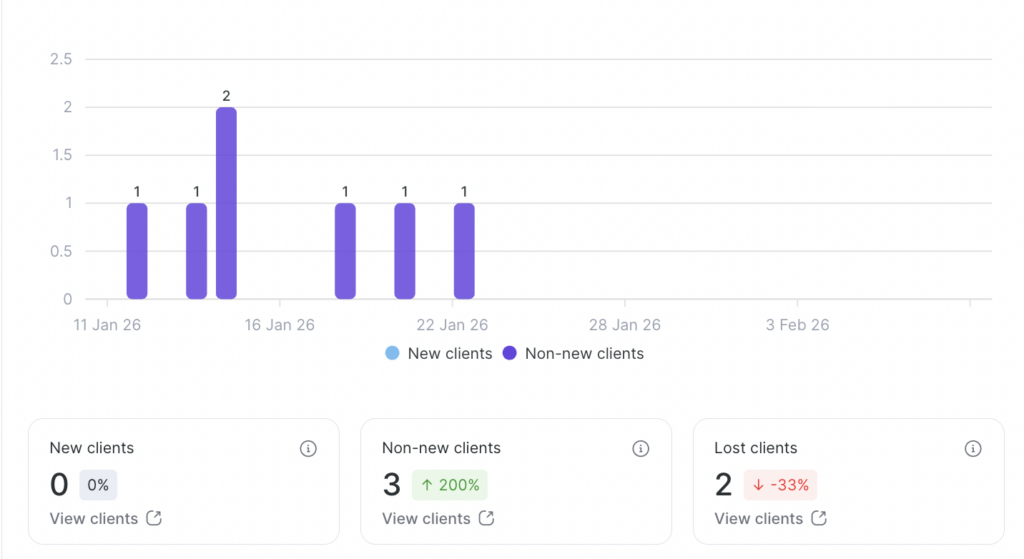
Clients #
- New clients. Number of clients who made their first visit during the selected period.
- Non-new (returning) clients. Number of clients who made their second or subsequent visit during the selected period.
- Lost clients. Shows how many clients had their last visit within a period equal in length to the selected one, and whose last visit ended the number of days specified under Analytics > Settings > Client Churn (details in the article) before the start of the selected period.
Appointments and Visits #
Total appointments. Total number of bookings, including cancelled (deleted) ones.
Cancelled. Total number of cancelled (deleted) bookings and visits with the status “No-show.”
Completed. Visits with the status “Arrived.”
Not completed. Total visits with statuses “Pending” and “Confirmed.”
Booking sources breakdown. Charts showing the distribution of bookings by source:
- Receptionist. Bookings created by administrators or employees through the journal.
- Altegio admin app. Bookings created through the staff mobile app.
- Website widget — desktop. Bookings through the online booking widget on a desktop browser.
- Website widget — mobile. Bookings through the widget via smartphone.
- Partners. Bookings via third-party platforms.
Important
There can be an unlimited number of online booking widgets (forms). They are all created under Online booking > Online booking forms. Other sources may also exist — for example, my-apps (booking via the previous generation mobile app).
For bookings made through the personal mobile app of Altegio, the source name will match the name of the online booking form created specifically for the app under Online booking > Online booking forms.
- Booking status breakdown. Charts showing the distribution of visit statuses: “Arrived,” “Pending” “Confirmed,” “No-show.”