
The Analytics > Team section shows how much revenue each team member generates over a selected period and across which key indicators.
Important
Statistics are calculated only for visits with the status “Arrived.”
What data is shown in the report #
- Team member
- Total revenue
- Revenue from services
- Revenue from services
- Number of provided services
- Revenue from products
- Number of sold products
- Hours worked
- Cost per hour
- Percentage of total revenue
How to read this report #
- To generate the report, go to the chain interface and open Analytics > Team section.
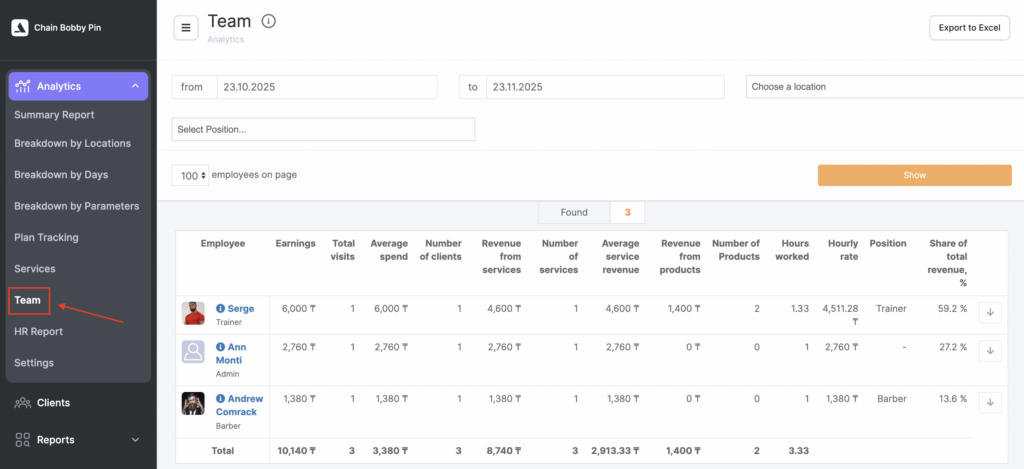
- Apply the necessary filters and click Show.
You can filter data by:
- Period
- Location
In the Percentage of total revenue column, you can open a chart showing on which days the team member generated more or less revenue. To view it, click the arrow icon next to the numeric value.
If needed, you can export the report to Excel.
Data exports are sent via email. The user receives a message containing a link to the export file.
After the export is created, a log entry appears in Reports > Activity Logs, showing who requested the file, when, and which data was exported.
You can also download the export file directly from the export log, provided you have the necessary permissions for that section.